First, the backstory. Growing up, I had quite a bit of difficulty understanding what made me happy and what did not. My definition of “happiness” changed over the years, however the mystery always remained: What are the things that actually makes me happy? Is it achieving things? Is it sitting back and playing videogames all day? Is it going out with friends even though I used to always perceive myself as an introvert? I had no idea and I usually just went with the flow.
However, around early 2019 -a time where I was having a really hard time in life-, I came across the following YouTube video:
I watched the video, and then thought to myself: “Well, how about I give this a try too? There isn’t much to lose”. So, starting around February 2019 until December 2021, I recorded how I felt every single day, with notes on what I did, and the emotions I felt throughout the day.
I stopped doing that in 2022 as I was serving in the military. So, I didn’t really have much time or ease of mind to track anything. In retrospect, I should have tracked these days, they’re some of the most packed (to say the least) days of my life. It would’ve been interesting to see statistics for them.
The Tracking Method
Back then I looked for an app that could let me track my days and be able to see statistics later on, with options to export data.
I didn’t have to look too much before I found Pixels - Mood & Mental Health. This app worked perfectly, as it let me track each day’s mood, what I did in it, what I felt, and be able to export the data in JSON format later on for analysis. The data is offline, so privacy isn’t a concern with this app.
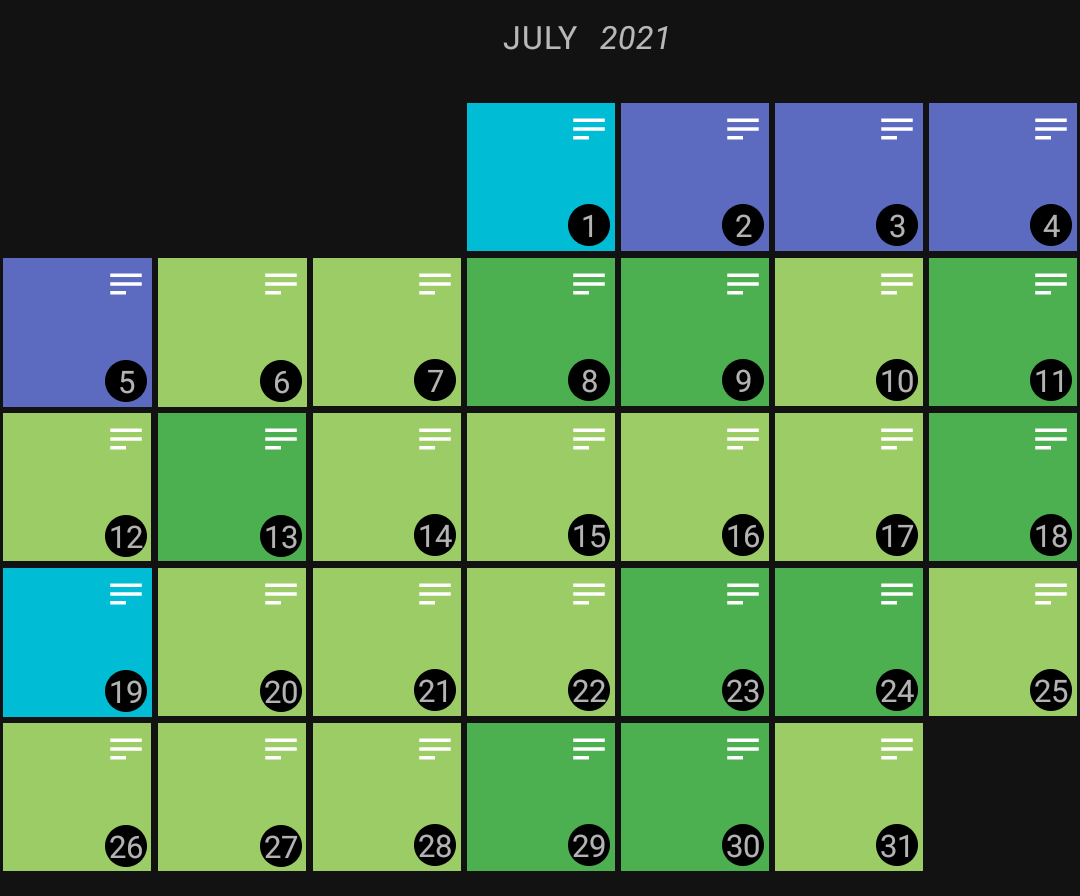
Pixels lets you pick a colour for every day alongside notes(a description text) and tags(emotions). Treating each day as a “pixel”, you end up seeing your month, then year, then life (hopefully) as a grid of pixels which generally indicate how happy you were!
This is not an advertisement for the app. I just think it is genuinely amazing and the creator is one of the most creative and “user-sympathetic” developers I have seen! If you wish to try this experiement too, I recommend you check it out.
![]()
When you log your days, you end up seeing something that looks kind of like this.
October 2023 Update! (Multiple moods per day)
When I first published this blog post, some people asked me how each day’s ending may affect the colour/pixel of the day. Say, for example. you had a good day but something bothered you at the end of it. What score do you give it? You don’t want that thing in the end to make you biased towards labelling it as a completely bad day. But, at the same time, you want to know what bothers you and how much it affects your mood.
What I usually did is that I would average it out, and explain in the description/note for myself that the day started out fine but X bothered me. This would make me later able to search for X and see how much it averages out. So if the day was a 4/5, I would give it a 2 or a 3 and explain that in the description.
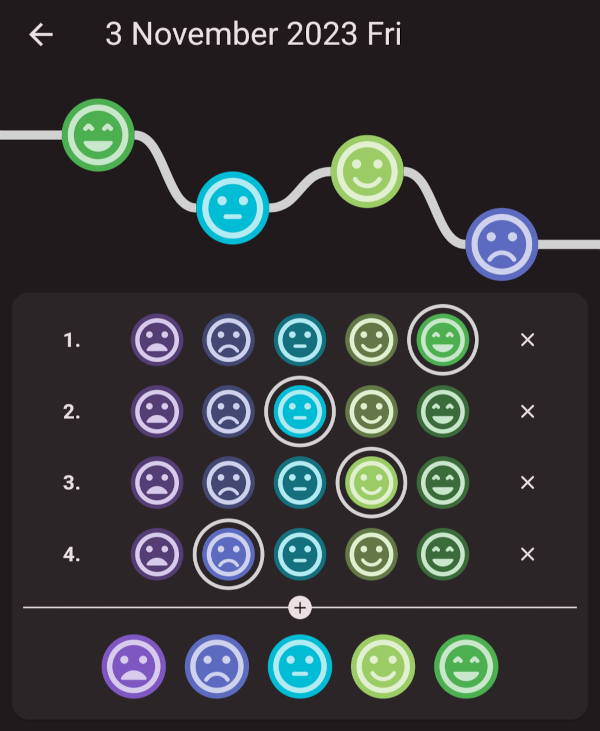
However, quick update! As of version 1.2.1 (29 Oct 2023), you can now choose multiple moods on the same day based on how your mood fluctuates throughout the day. This solves the problem!
The Results
After almost 3 years of collecting my own data (Sorry, Mr. Zuckerberg), I found some really good results. The results helped me generally understand myself better and also see some really interesting patterns. Sometimes, I am able to link the statistics with real life events and sometimes I’m not, which doesn’t matter as in both cases I got to know the facts anyway.
Let’s look at some samples of the results, specifically between 2020 and 2021.
2020 vs 2021
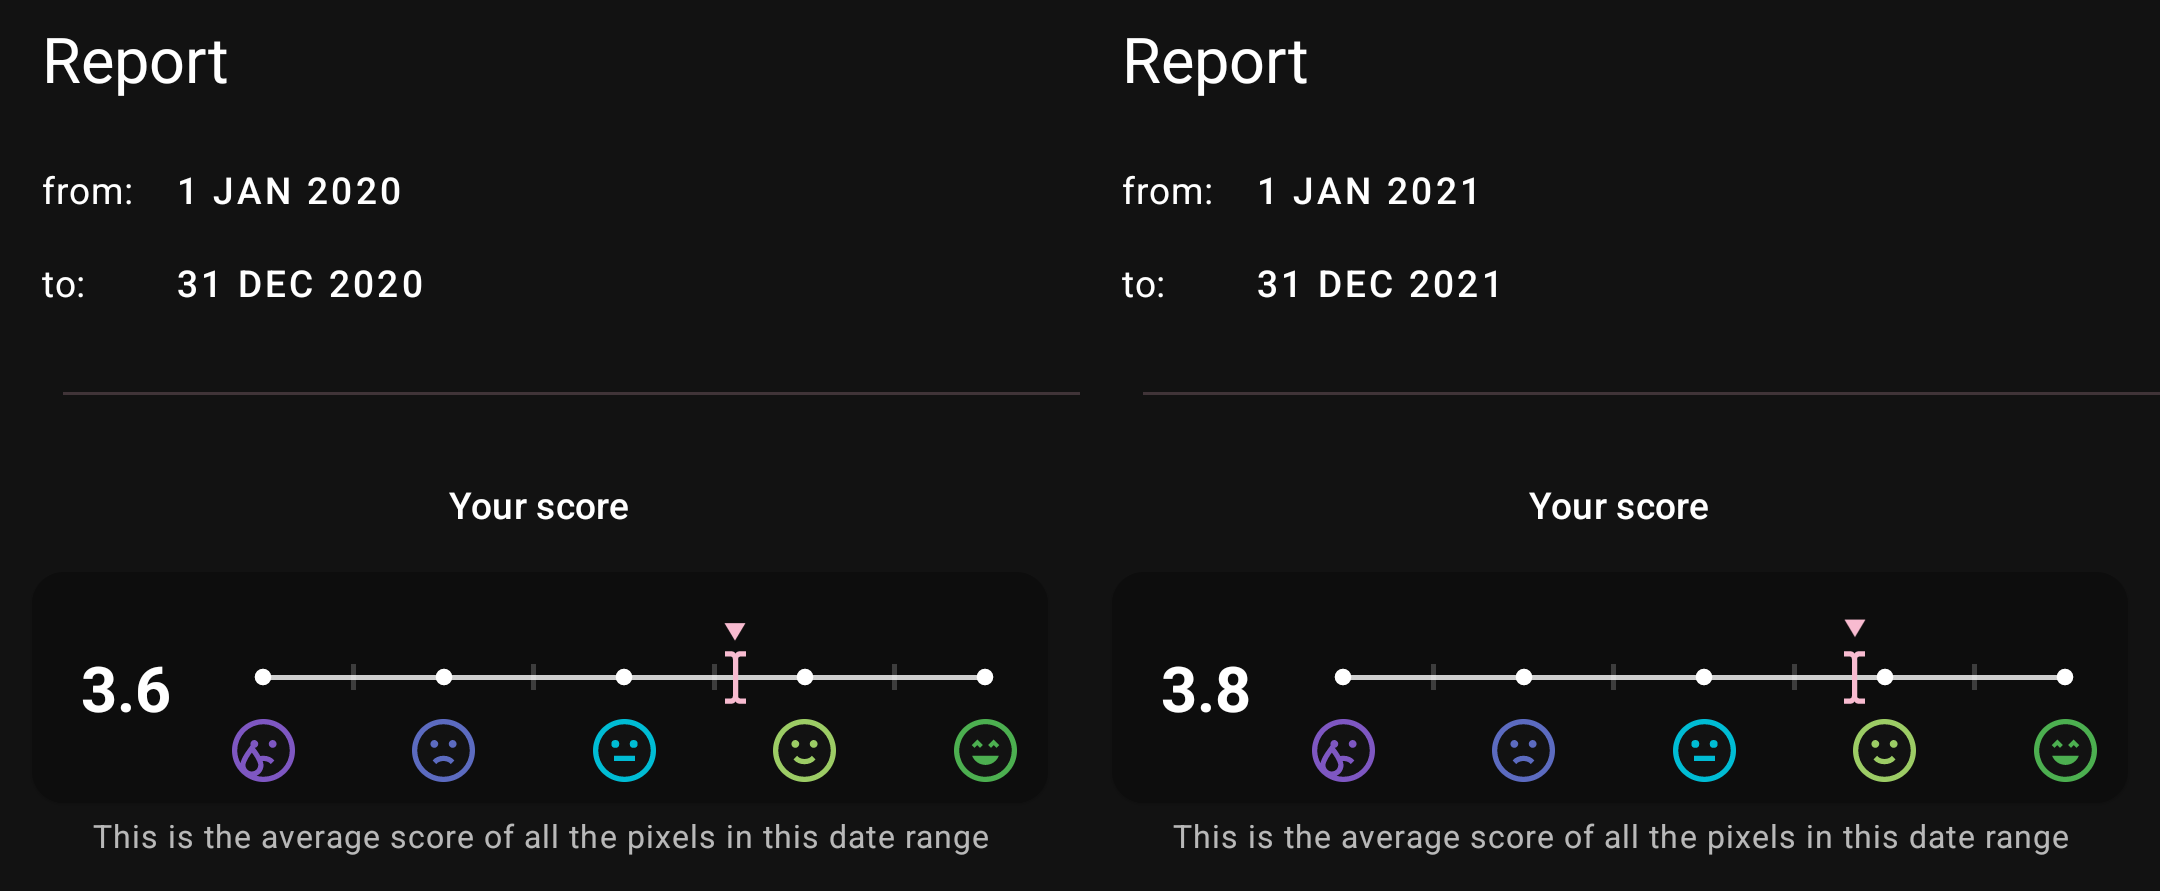
Looking at the previous image, you can find that 2020 was generally a less happy year for me compared to 2021. Which is pretty accurate. 2020 was very difficult for not just me, but everyone. However, I had a few hardships in 2020 which made it way less of a good year.
Days of the Week
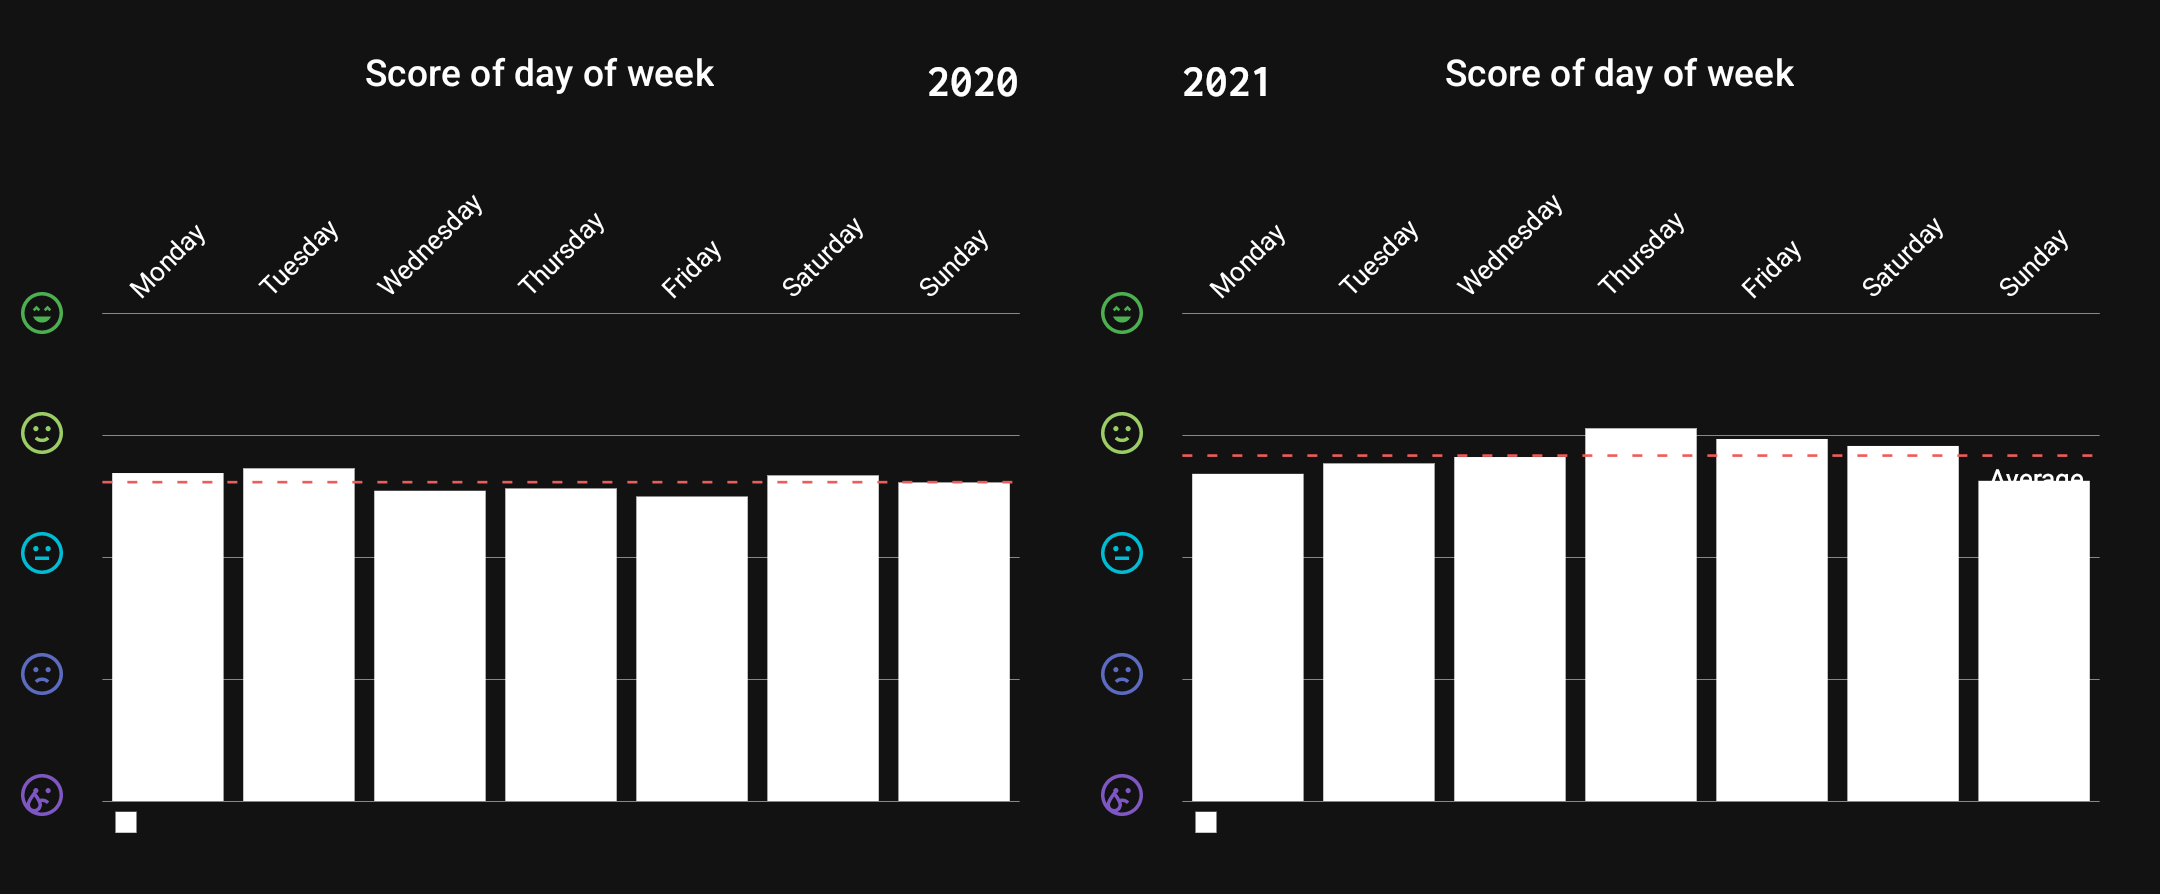
For example, let’s take a look at the average happiness score of each day across the two years. Fridays were way below average for me in 2020 as usually on Fridays I’d go out or maybe go cycling early in the morning. Sadly, during COVID-19 they weren’t really valid options throughout most of the year.
On the other hand, in 2021 I got a full time job where I worked more regularly and got to rest on weekends. So like any employee in the world, I dreaded the first day of the week (in this case Sunday, for any non-Egyptian readers) and was really happy on Thursdays as it is the end of the working week!
Is this news to me? Yes. I never really imagined that having a good weekend to myself mattered this much. Now, I prioritise that I rest and do fun hobbies on weekends to recharge. Back in the day, before seeing such statistics for my own life, I’d sometimes force myself to finish stuff on the weekend and it apparently did have its effect on me.
Keywords
I was also curious to see how I felt on days where I mentioned something specifically in the description. As usually, if it was significant enough, I’d write about it in the notes for the day. Let’s look at two examples.
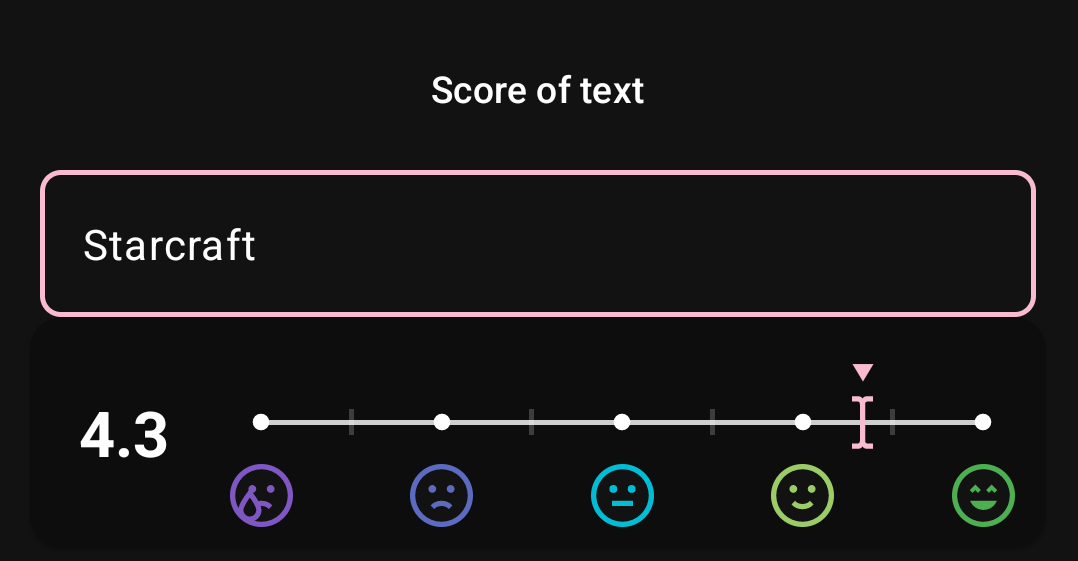
You can see that throughout 2020, days where I mentioned Starcraft (a videogame I was really interested in at the time) I was relatively happy.
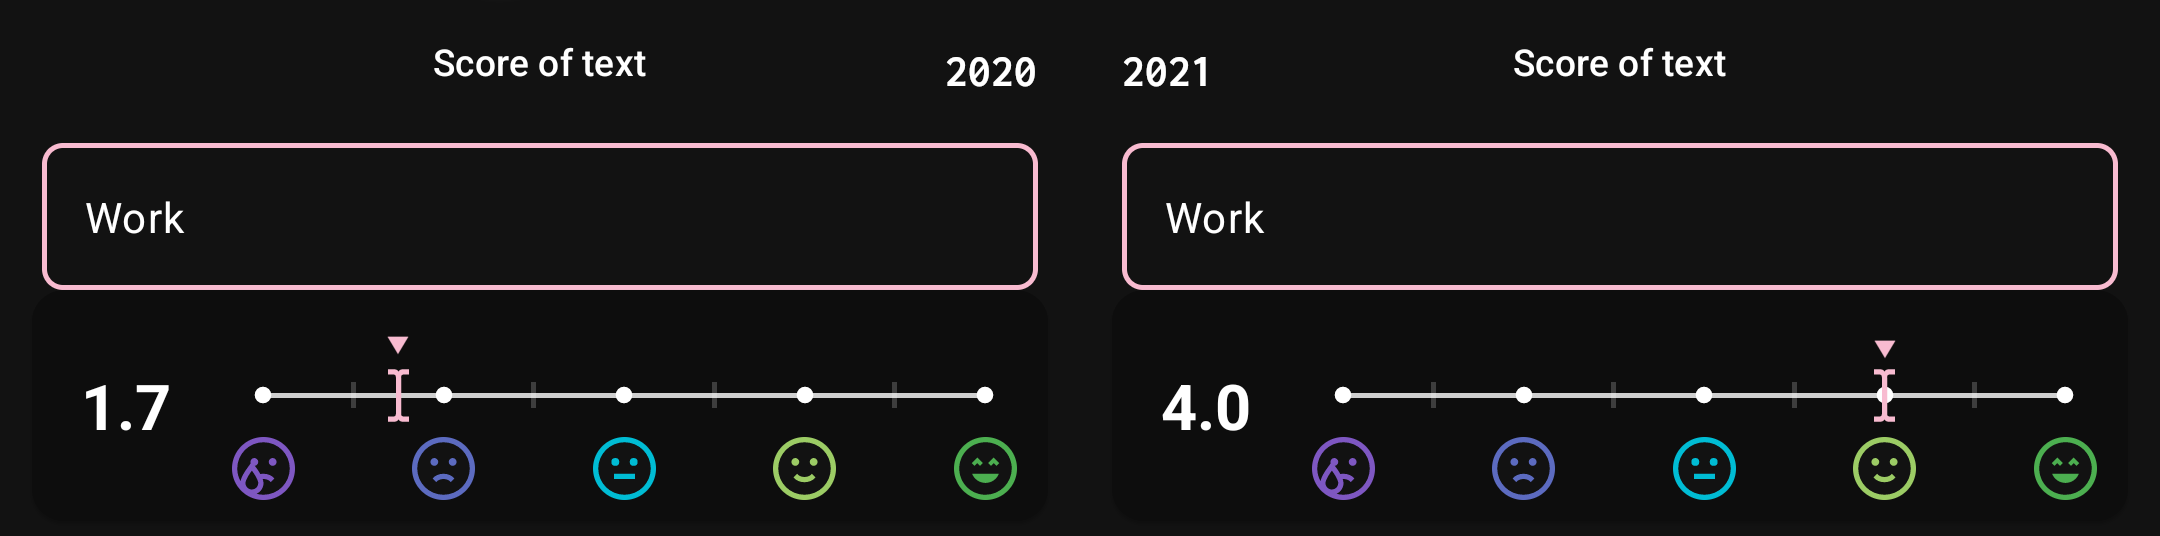
In contrast, the days where I mentioned work in 2020 were pretty bad days. This makes sense as in 2020 I didn’t really work a job I liked and it was very stressful for me. In an ever more apparent contrast, the days where I mentioned work in 2021 were way better. In 2021, I started another job and felt much happier doing my day-to-day job!
Emotions
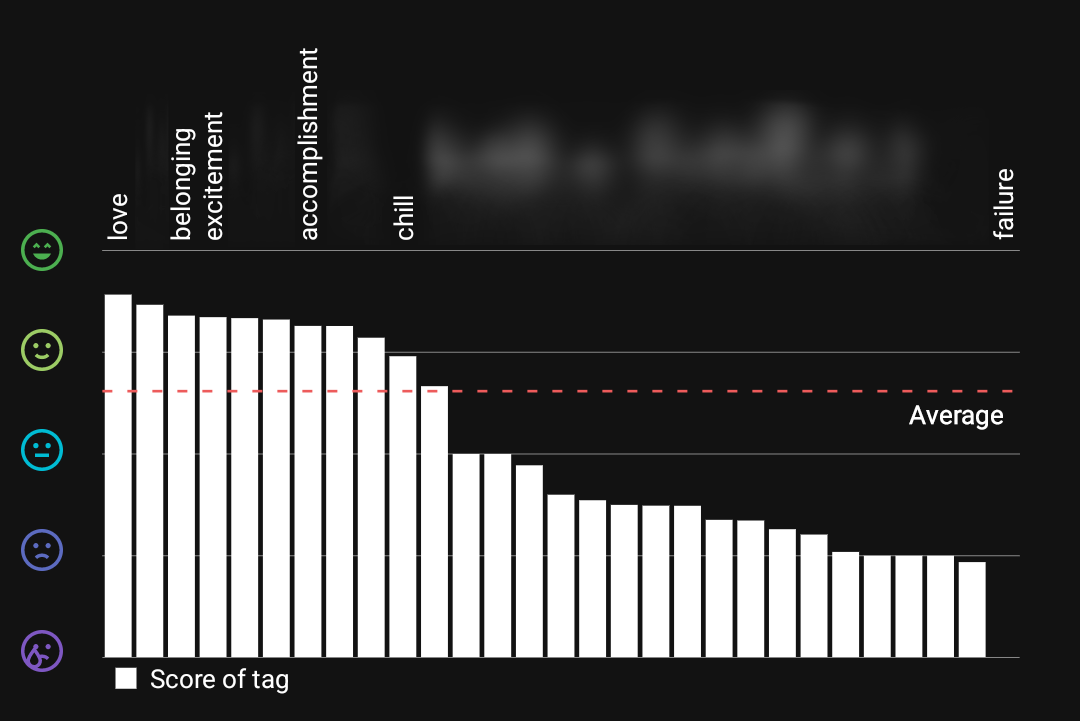
Now to the final statistic I am showing. Psychiatrists would disagree with me on calling the words in this chart “emotions” and what not but please don’t @me, I am just a tech guy trying to get a grasp on his -way more complex than tech- emotions.
Anyway, according to the chart, you can see that days where I log that I am feeling “love” or “belonging”, I am super happy.
Being “excited” for something or accomplishing things makes me feel relatively happier than just feeling “chill” and taking a break. Even if I enjoyed both activities!
And of course, feeling like I have failed at something makes me feel much worse than anything else listed here, as you can probably tell by the chart.
The Verdict
Track your life. I genuinely can’t recommend it enough! Knowing is always better than not knowing. Using an app such as the one I mentioned, or any other app makes it a much easier process.
From my own, non-scientific(ish?) experience, tracking my life has helped me a lot in understanding myself, my own emotions, and has really helped me free my mind.
You don’t have anything to lose.
- Choose an app you like, or even use an offline method such as a notebook
- Spend a minute every day logging for a month or whatever time period you like
- Start observing your patterns and maybe decide for yourself if it is worth it or not!
Note: The more data you collect, the more valuable your results are.
I thought that this post would be nice to post at the start of the year. I’ve had it in my backlog for much longer than I can remember.
I wish you all a happy 2023, full of happiness and successes! I do plan to try and put out more regular content on my blog this year. (please don’t quote me on this)
Anyway, I hope you enjoyed this post and it was insightful for you somehow. If you decide to track your life, feel free to tell me your results and if it helped you in any way!
And as always, thanks for reading!
But wait, there’s a bonus! This post was already long enough, so I wanted to add a small bit as a bonus.
Bonus
Quarantine
Here are my pixels for the first few weeks of 2020s long COVID-19 quarantine. It started in Egypt around the 14th of March.
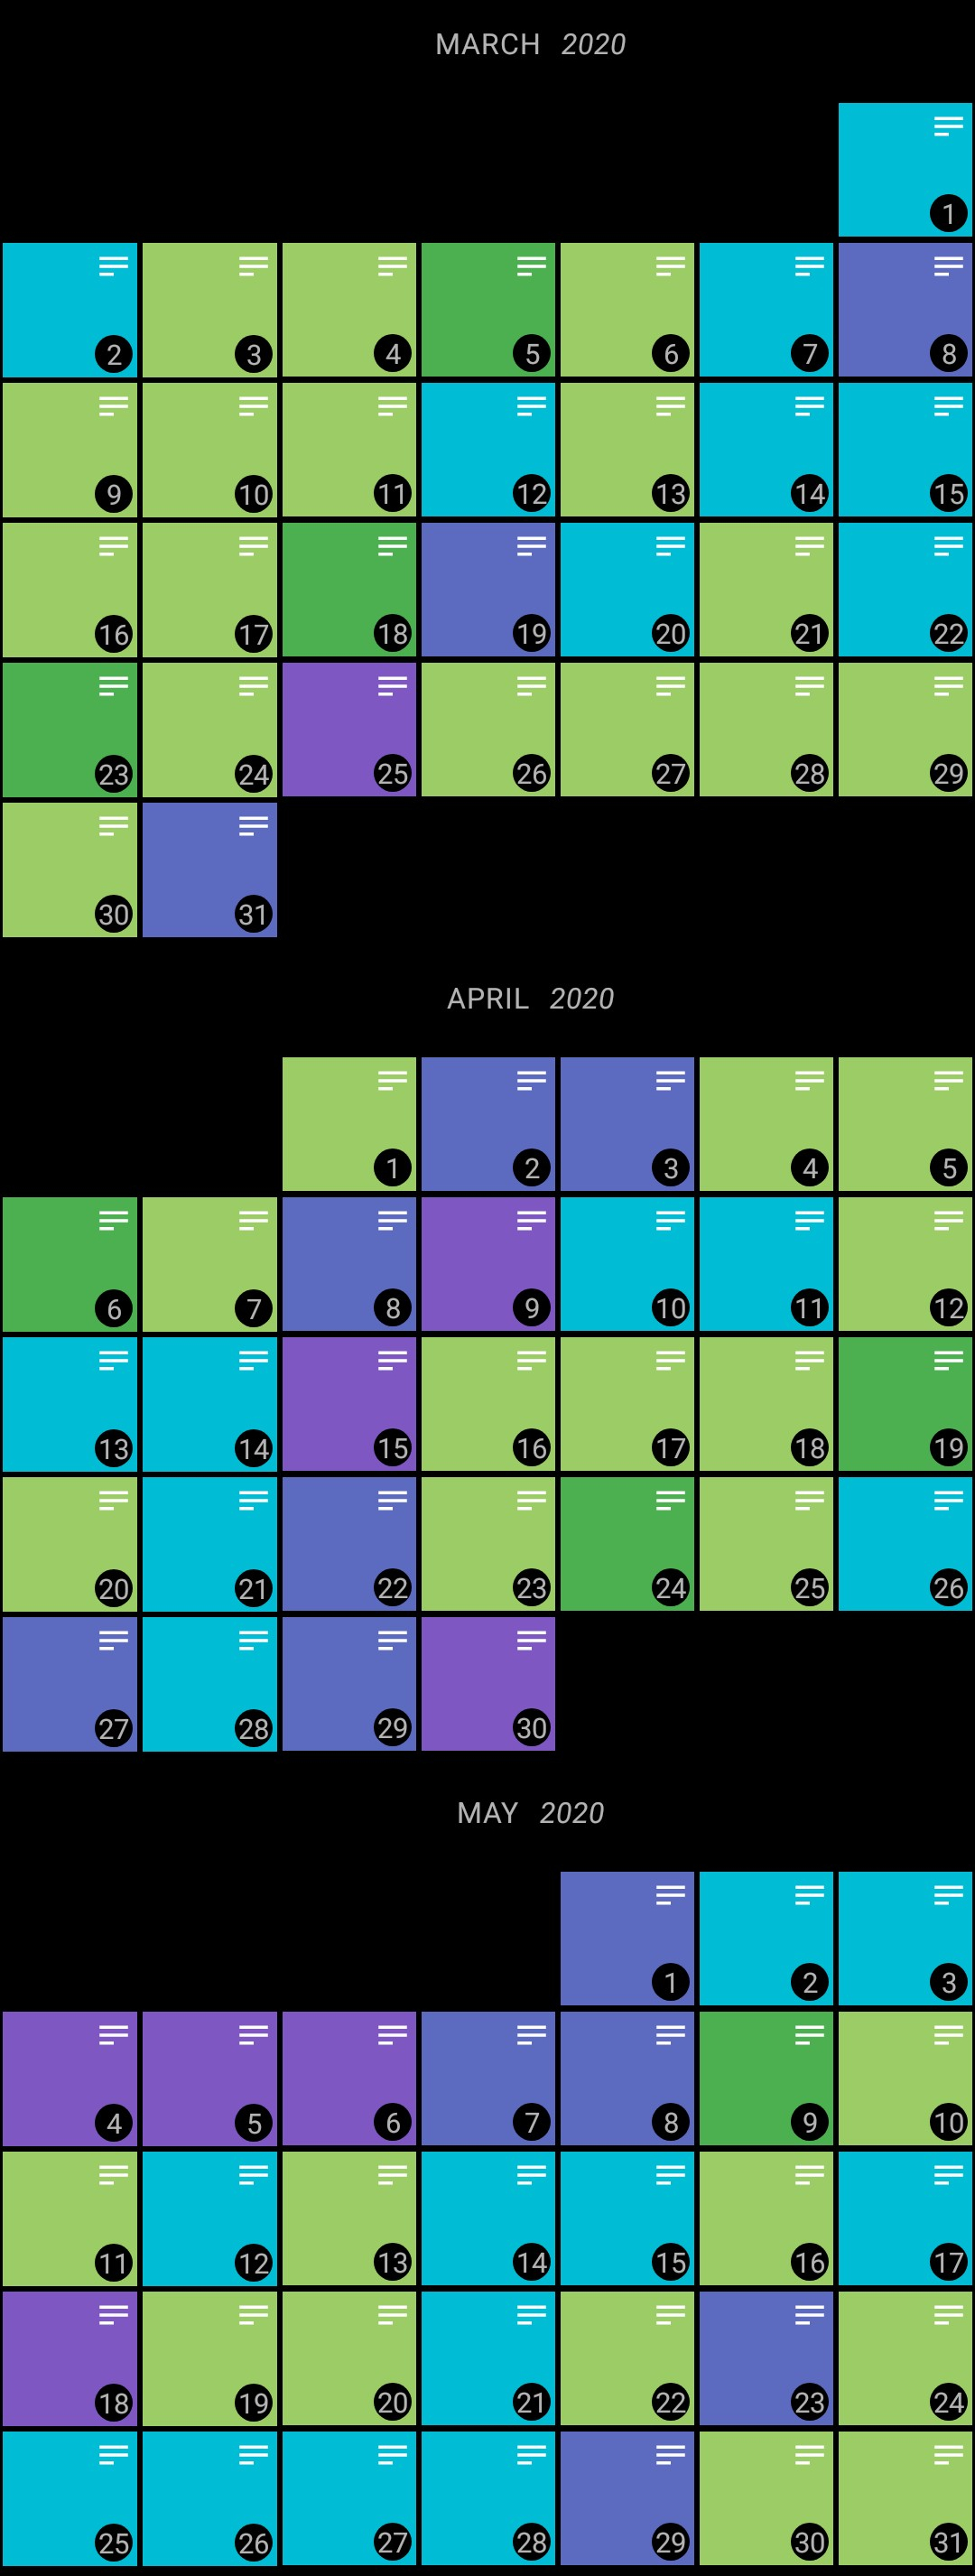
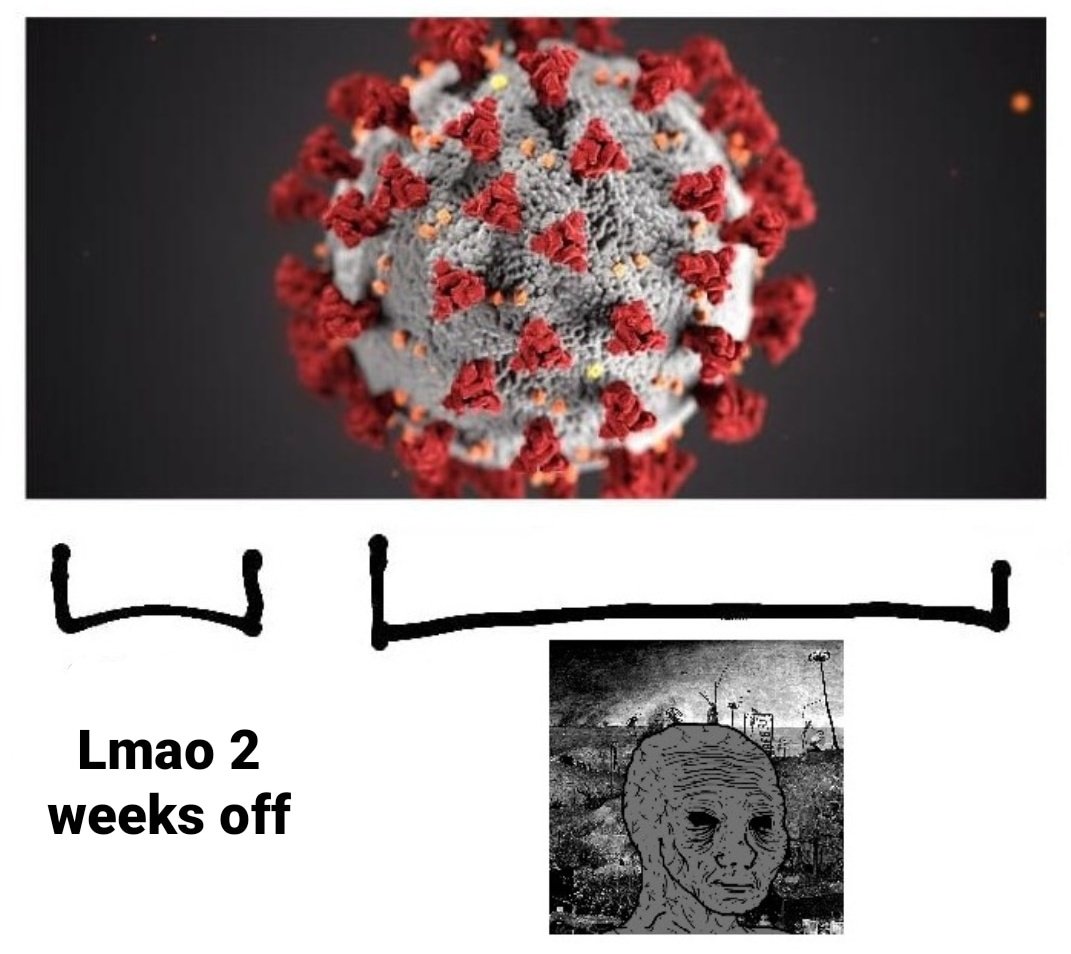
You can see that it started out fine, and then suddenly all happiness crashed down and then kept fluctuating. Reminds me of this meme: